Kitagawa Balloon Test: History, Validation and Limitations
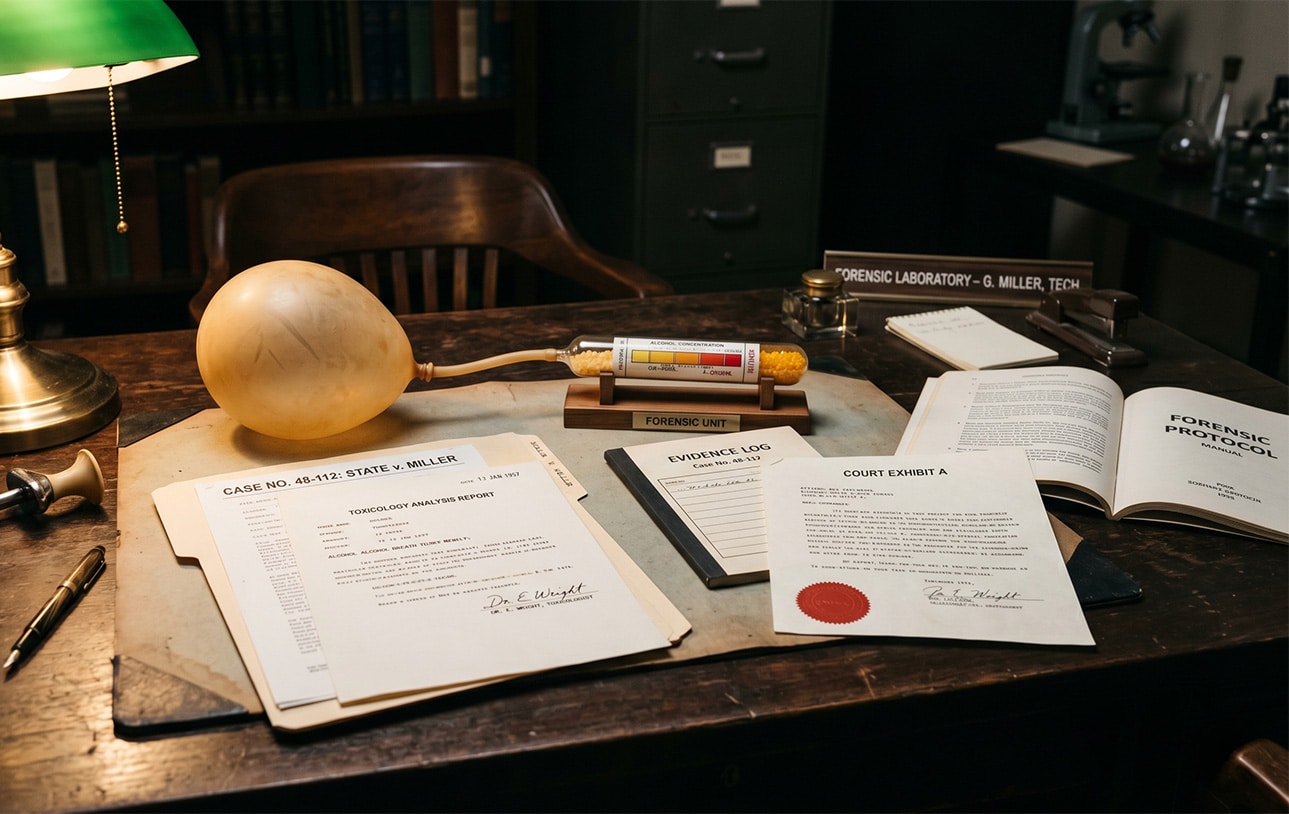
Article overview: The Kitagawa balloon test, more precisely the Kitagawa-Wright detector-tube method, is sometimes treated in courtrooms and older case files as if it were a scientifically grounded measurement of blood-alcohol concentration . It is not. The most striking feature of the historical record is that the…
By Okorie Okorocha, J.D., M.S., M.S.
The Kitagawa balloon test, more precisely the Kitagawa-Wright detector-tube method, is
sometimes treated in courtrooms and older case files as if it were a scientifically
grounded measurement of blood-alcohol concentration. It is not. The most striking
feature of the historical record is that the people best positioned to defend the device,
the inventors themselves and the first independent validators, never claimed otherwise.
The published record from 1962 through 1964 already documented the limitations that
modern litigation continues to grapple with. This post walks through what those original
sources said, in their own words, and ties them to the broader scientific problems that
any breath-alcohol method must confront.
The Device, in the Words of the Inventors
T. Kitagawa and B.M. Wright introduced the apparatus in the British Medical Journal in
September 1962 as “A Quantitative Detector-tube Method for Breath-alcohol
Estimation” (Kitagawa & Wright, 1962). The chemistry uses chromic acid adsorbed on
silica particles. The reagent is yellow when anhydrous and turns bluish grey when
ethanol reduces it. The subject blows into the apparatus through a balloon-and-reservoir
arrangement, and a pump pushes a fixed volume of breath across the reagent. The
operator then reads the length of the discolored band against a scale.
Three things in the original 1962 paper deserve attention:
First, the inventors openly described their predecessor tubes, including Kitagawa’s own
earlier “Drunkotester” used by Japanese police, as devices that had no pretensions to accuracy and were intended only for screening, with positive results requiring a
confirming blood test. The Kitagawa-Wright apparatus was an attempt to improve on
those tubes, not to replace blood analysis.
Second, the linearity of the device was modest from the start. The 1962 paper reported
that the chemistry was “practically linear from 50 to 200 mg” per 100 mL, with a footnote
acknowledging that the response “falls away from linearity” above 150 mg/100 mL and
required an operating temperature adjustment to partially correct.
Third, the validation in the original paper rested on very limited human data. The
inventors reported one subject who produced twelve successive readings of 10, 9, 9,
10, 9, 9, 10, 9, 9, 9, 9, 9 mm (Kitagawa & Wright, 1962), and a separate six-subject
correlation between successive samples. That is the foundational human-subject
evidence on which the apparatus entered the world.
The 1964 Begg, Hill & Nickolls Trial
The first serious head-to-head trial of the Kitagawa-Wright method against the
Borkenstein Breathalyzer was published in the British Medical Journal by Begg, Hill,
and Nickolls in January 1964. It ran 318 breath samples through three methods (direct
breathalyzer, breathalyzer bag, and Kitagawa-Wright), drew venous blood as the
reference, and used trained laboratory personnel under controlled conditions. It is
essentially a best-case validation.
The Kitagawa-Wright method finished last among the breath methods on every
measure of reproducibility, and the trial reported the data plainly.
Reproducibility. The standard deviations of individual readings ranked: blood 3.66
mg/100 mL, breathalyzer bag (1 day) 5.81, direct breathalyzer 7.29, Kitagawa-Wright
(immediate) 8.37, Kitagawa-Wright (1 day) 8.76, Kitagawa-Wright (7 days) 10.23 (Begg,
Hill, & Nickolls, 1964, Table I). The Kitagawa-Wright method was the noisiest of the
breath methods even when read immediately, and the precision degraded further the
longer the tube sat.
Confidence range. Expressed as the range on either side of the true value within
which observations would fall, the Kitagawa-Wright method showed ±16.4 mg/100 mL at
95%, ±21.6 at 99%, and ±27.5 at 99.9% (Begg et al., 1964, Table II). For perspective,
U.S. and California jurisprudence routinely treats a 0.08 result as conclusive. A method
whose 99% confidence range is roughly ±0.022 g/100 mL cannot support that kind of
categorical use.
B.M. Wright’s own admission. Two weeks after the Begg trial appeared, the co-
inventor B.M. Wright wrote a letter to the same journal restating the confidence limits in
a way that left no ambiguity. Wright reported, working from Hill’s analysis, that if the
Kitagawa-Wright apparatus reads 100 mg/100 mL, the blood value at 1% chance could
be as high as 126 or as low as 74 (Wright, 1964). That is a confidence band of roughly
±26 mg/100 mL around a single reading, conceded in print by the device’s co-creator.
Operator-dependent variability. The trial identified two operator-controlled variables
that moved the result significantly. The pumping time across the detector tube ranged
from 1.6 to 10.5 minutes across operators and occasions, and each additional minute
added about 3.9 mg/100 mL to the reading (Begg et al., 1964). That is a non-trivial drift
driven entirely by how the operator handled the pump.
Reagent batch variability. The same trial found that one batch of detector tubes gave
readings on average 7.8 mg/100 mL higher than another batch under the same
conditions (Begg et al., 1964). A 0.008 swing based on which box the tube came from,
before any subject biology is considered, is a serious problem for a method being asked
to support criminal charges at fixed statutory thresholds.
Low-end and high-end distortion. The Kitagawa-Wright method tended to read low at
low blood levels (with zero readings often obtained when blood alcohol was low) and
high at the highest levels (Begg et al., 1964). The instrument was directionally biased at
exactly the ranges that matter most for prosecution.
Storage degrades the read. Begg et al. (1964) further reported that the stain end-
point was clear-cut immediately after exposure to alcoholic air, but after 24 hours the
interface became indistinct and the apparent reading drifted (upward at high
concentrations, downward at low ones). The “permanent record” feature that the 1962
paper offered as a courtroom advantage is, on the data, not actually permanent.
Mouth Alcohol
Begg et al. (1964) also conducted a controlled mouth-alcohol experiment. Eight
subjects, four with dentures, swilled 10 mL of 70-proof whisky for ten seconds and
expelled it without swallowing. Five minutes after the swill, breathalyzer-bag readings
were in the range of 38 to 172 mg/100 mL (Begg et al., 1964). Within fifteen minutes the
readings fell to 1 to 8 mg/100 mL.
Two implications follow. First, residual mouth alcohol can fully overwhelm any breath-
alcohol device, Kitagawa-Wright included, for the first several minutes after contact with
ethanol. Second, a 15-minute pre-test deprivation and observation period is a
physiological necessity, not a bureaucratic technicality. California codified that
protection in 17 CCR §§ 1219.3 and 1221.4 for evidential breath instruments. The
Kitagawa procedure has no analog.
The mouth-alcohol problem is broader than the single drink scenario tested by Begg et
al. As I have written previously, the more common contamination mechanism is not
regurgitation but the silent gastric reflux of ethanol-containing stomach gases, which
can vitiate a breath sample without any external sign (Okorocha, 2012, J. Forensic Sci.). Dental work, bridges, dentures, and oropharyngeal anomalies further extend the
time ethanol persists in the upper airway. None of these are addressed by a length-of-
stain detector tube.
Pharmacokinetics and Breath Testing
A breath result is meaningful only if the subject’s ethanol pharmacokinetics are in a
stable, post-absorptive state. During absorption, blood-alcohol concentrations are
variable, nonuniform, discontinuous, and unpredictable, and the relationship between
breath and blood is unstable (Okorocha, 2012). Begg et al. (1964) recognized this and
deliberately drew venous blood only after the blood-alcohol curve had been falling for
some time. They explicitly excluded the absorption phase from their breath-blood
correlation. That is the right scientific move. It is also a move that no roadside or station-
house Kitagawa test can replicate, because the test is administered when the suspect is
presented, not when the suspect is pharmacokinetically convenient.
The Blood-to-Breath Ratio (BBR)
The Kitagawa-Wright apparatus, like every other breath-alcohol device, has to convert a
breath measurement into a blood-equivalent value using an assumed conversion factor.
The U.S. forensic community has historically used 2100:1. The actual blood-to-breath
ratio (BBR), measured in real subjects, varies enormously. Jaffe and colleagues, in a
study otherwise endorsing breath testing, reported individual BBR values ranging from
1214 to 2859 across 181 paired comparisons, a 260% spread (Okorocha, 2013, J. Forensic Sci., commenting on Jaffe et al.). Labianca and Simpson had already
published similar variability nearly two decades earlier. A subject at the low end of that
distribution would have a true blood value far above what any 2100:1 device, Kitagawa-
Wright included, would report. A subject at the high end would have a true blood value
far below.
The conceptual problem is even more serious than the numerical range. The traditional
model assumes that exhaled breath reflects the alcohol concentration in deep alveolar
air, which is in equilibrium with pulmonary capillary blood. Hlastala’s paradigm-shift
work, summarized in the Journal of Forensic Sciences in 2010, shows that exhaled
breath alcohol actually originates from the bronchial (systemic arterial) circulation
perfusing the conducting airways, not from the deep alveoli. As I noted in my 2014
commentary on Vosk et al., the substantial arterial-venous alcohol difference during the
absorptive and post-absorptive phases makes the entire breath-to-venous-blood
conversion an indirect inference, not a direct measurement (Okorocha, 2014, J. Forensic Sci.).
A more complete treatment of these points appears in my law-review article with
Matthew Strandmark, Alcohol Breath Testing: Is There Reasonable Doubt?, 27
Syracuse J. Sci. & Tech. L. 124 (2012), which surveys the historical, physiological, and
statistical case against treating breath-alcohol values as reliable proxies for blood-
alcohol concentration.
Reagent Non-Specificity
Begg et al. (1964) discussed acetone interference at length and concluded that, in
practice, the dichromate chemistry of the breathalyzer was satisfactory because
acetone produced only small readings under their conditions. They noted, however, that
ether and paraldehyde also react with dichromate, and that methyl alcohol gives
positive readings indistinguishable from ethyl alcohol on the standard two-minute read.
The Kitagawa-Wright reagent uses essentially the same chromic acid chemistry, so the
same interferents apply, with the additional disadvantage that a length-of-stain readout
offers no kinetic check (such as the breathalyzer’s optional 10-minute methanol
confirmation).
Putting It Together
The historical case against treating a Kitagawa-Wright result as an evidential blood-
alcohol value is built almost entirely from the device’s own foundational literature:
- The inventors described the predecessor tubes as having no pretensions to accuracy
and as screening tools only (Kitagawa & Wright, 1962). - The first independent validation showed it was the noisiest breath method tested, with
a 99% confidence band of roughly ±0.022 g/100 mL even under ideal lab conditions
(Begg et al., 1964). - The co-inventor publicly conceded that range in print (Wright, 1964).
- Operator-controlled pumping time and reagent batch each produced shifts of several
mg/100 mL (Begg et al., 1964). - The stain itself degrades within 24 hours, undermining the “permanent record” claim
(Begg et al., 1964). - The method has no mouth-alcohol safeguard, no pharmacokinetic safeguard, no BBR
adjustment for individual subjects, and no slope-detection capability. - Modern pulmonary physiology has further eroded the underlying premise that exhaled
breath reflects deep alveolar blood-alcohol concentration (Hlastala, 2010; Okorocha &
Strandmark, 2012; Okorocha, 2014).
Nothing in this list is hostile commentary from a defense expert. It is the literature the
device’s creators and earliest validators put into the record themselves.
A Kitagawa balloon result, treated honestly, tells you that ethanol or an ethanol-like
reducing substance was present in the breath at the time of the test. It does not tell you
the subject’s blood-alcohol concentration, it does not tell you whether the subject was
impaired, and it does not satisfy any modern evidential breath-testing scheme in the
United States. When such a result appears in a case file, that is how it should be
presented to the trier of fact.
References
- Begg, T.B., Hill, I.D., & Nickolls, L.C. (1964). Breathalyzer and Kitagawa-Wright
methods of measuring breath alcohol. British Medical Journal, 1, 9-15. - Hlastala, M.P. (2010). Paradigm shift for the alcohol breath test. J. Forensic Sci.,
55(2), 451-456. - Kitagawa, T., & Wright, B.M. (1962). A quantitative detector-tube method for breath-
alcohol estimation. British Medical Journal, 2, 652-653. - Okorocha, O. (2012). Commentary on Sterling K., The rate of dissipation of mouth
alcohol in alcohol positive subjects. J. Forensic Sci., 57(4), 1140. - Okorocha, O. (2013). Commentary on Jaffe DH et al., Variability in the blood/breath
alcohol ratio and implications for evidentiary purposes. J. Forensic Sci., 58(5), 1405. - Okorocha, O. (2014). Commentary on Vosk T. et al., The measurand problem in breath
alcohol testing. J. Forensic Sci., 59(4), 1162. - Okorocha, O., & Strandmark, M. (2012). Alcohol breath testing: Is there reasonable
doubt? 27 Syracuse J. Sci. & Tech. L. 124. - Wright, B.M. (1964). Breath alcohol analysis [Letter]. British Medical Journal, 1, 182.
Okorie Okorocha, J.D., M.S., M.S., is the State Bar of California’s only attorney board- certified in both criminal and civil trial law. He holds dual M.S. degrees in Forensic Toxicology and Pharmaceutical Sciences from the University of Florida and has testified as a forensic toxicology expert in more than 900 court proceedings and 3,500+ DMV hearings across 27 states.
The Okorocha Firm • 214 N. Main Street, Suite 296 • El Segundo, CA 90245 • (424) 363-3347 • oo@ooesq.com • @Toxlawyer
Related reading: Browse the Forensic Toxicology topic hub.