Drug Surveillance Statistics in Court: The Denominator Comes First
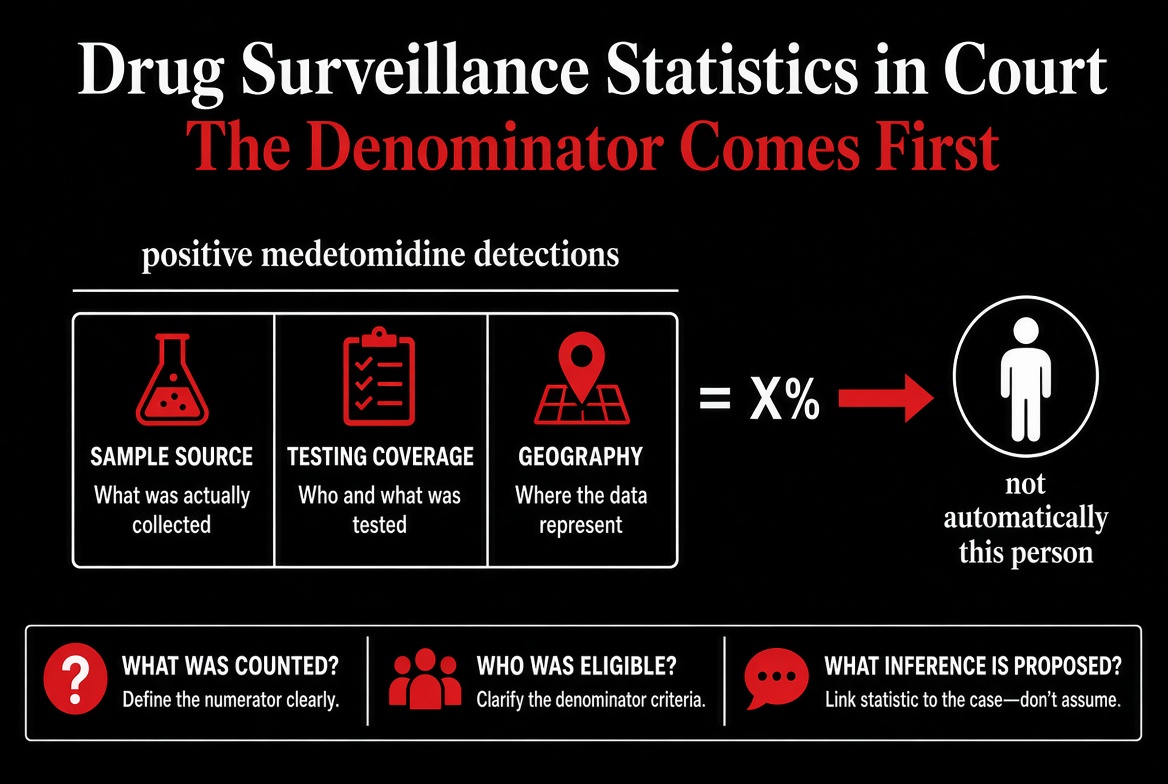
A statistic about seized powders is not automatically a statistic about people, overdoses, or drivers. When surveillance data appear in an expert report, the first task is to identify what was counted and how it entered the dataset.
This matters because surveillance can justify further investigation while remaining unsuitable for estimating an individual's exposure. A local alert may make an untested drug worth considering; it cannot supply the missing laboratory finding for a particular person.
One study, several different denominators
A Connecticut study of four 2025 fentanyl-involved datasets reported medetomidine in 1.4% of 579 overdose fatalities, 41.7% of 259 seizure units, and 24.9% of 177 DUI cases. Among 169 fentanyl-positive community samples, test strips were positive in 46.2% on average and FTIR detected medetomidine in 28.4%. Confirmatory testing of fatalities was limited. Peer-reviewed study, September 15, 2026; abstract-only access, DOI: 10.1097/ADM.0000000000001779.
Those values describe different observation systems. They should not be averaged into a single statewide prevalence estimate, nor should the difference between strip and FTIR percentages be labeled a false-positive rate without the necessary paired reference-standard data.
Define the population the opinion actually concerns
Ask whether the proposed opinion concerns the drug supply, people who use a particular product, all drivers, suspected impaired drivers, emergency patients, or deaths. Then compare that target with the population actually sampled. A dataset restricted to fentanyl-involved cases does not estimate medetomidine prevalence among everyone in the jurisdiction.
The unit matters as much as the population. Several seizure units might arise from one investigation. Several specimens might come from one person. A submitted drug sample may represent only a portion of a product. Determine whether the study counted units, cases, specimens, or unique individuals before describing its percentages.
Geography and time also matter. A result from one state in 2025 may provide background for a later case elsewhere, but the connection must be explained. “Recent” and “widespread” are not substitutes for identifying the relevant period and place.
Evaluate ascertainment before interpreting change
A rise in detections can reflect a change in exposure, testing coverage, submission practices, or several of these at once. Ask whether the laboratory added the analyte, lowered a reporting threshold, changed its method, or began testing a more selected group.
This does not make surveillance uninformative. It identifies what additional evidence would support an explanation of the trend. Stable testing in a comparable population generally answers a different question from a newly expanded panel applied to selected suspicious cases.
If a report compares methods, request the sample-level agreement table, treatment of invalid results, and independent confirmation strategy. Higher positivity alone cannot determine which method is more accurate.
Use the statistic for the conclusion it can support
Surveillance can support statements about observed detections, the need for appropriate assay coverage, and reasonable investigative leads. It rarely establishes that a particular untested product contained an adulterant, that a person knew about it, or that the adulterant caused the event.
A useful report includes the numerator, denominator, eligibility criteria, testing method, and uncertainty beside the statistic. A useful cross-examination asks: “What population does that percentage describe, and what additional evidence connects it to this person?” Those two questions often expose the exact point where valid background information has been turned into an unsupported individual conclusion.