Drug Recognition Expert (DRE) Program Analysis

FORENSIC SCIENCE
The DRE Hoax
Anatomy of a forensic illusion: why the “Drug Recognition Expert” evaluation looks like science, and why its own validation studies prove almost nothing.
Analysis — Forensics Desk · 12 min read · Sources: Kane 2013, Heishman 1996, UMFC 2021
A police officer shines a penlight in a driver’s eye, watches them walk a line, takes their pulse, and then declares — under oath, as an “expert” — exactly which category of drug is impairing them. It is theater dressed as toxicology. And when you trace the science that supposedly validates it, the whole structure collapses into a single, fatal flaw: the program’s evidence measures everything except whether the test actually works.
The Drug Evaluation and Classification (DEC) program — and the Drug Recognition Experts (DREs) it certifies — has the trappings of rigor: a standardized 12-step protocol, national certification through the IACP, and impressive-sounding “accuracy” rates cited in courtrooms across the country. Pull on any one of those threads, though, and the same problem appears. Here is how the case against it breaks down.
01 / THE CIRCULAR ENGINE
A test that cannot be wrong
The Drug Influence Evaluation is built as a closed loop. A failed field sobriety test is treated as proof of impairment. The officer then predicts a drug category. Toxicology that finds a drug in that category is read as confirming the impairment the field test already “proved.” The conclusion is wired back into its own premise.
It gets worse. In some validation accuracy calculations, when a drug from the predicted category is not found, any drug in any other category still counts as confirmation — after all, the officer predicted a drug, and a drug was found. A method designed so that it can essentially never be contradicted is not a diagnostic test. It is a ritual.
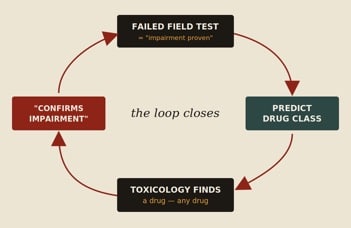
Figure 1. The Drug Influence Evaluation is engineered as a self-confirming circle. Each output is fed back as proof of the input — leaving no path by which the method could ever be shown wrong.
02 / THE 94% MIRAGE
A coin flip does just as well
Prosecutors love the headline number: in the Compton (“LAPD 173”) study, when DREs said drugs were present, drugs were found in the blood 94% of the time. It sounds like near-perfect accuracy. It is a statistical artifact.
The 173 subjects were not random drivers. They were people already arrested for drug-impaired driving by non-DRE officers — so roughly 94% of them already had drugs on board before any DRE looked at them. The DREs then opined that nearly everyone was impaired. Of course they were “right” 94% of the time: 94% of the room was positive to begin with. The number reflects the prevalence of drugs in the sample, not the skill of the examiner.
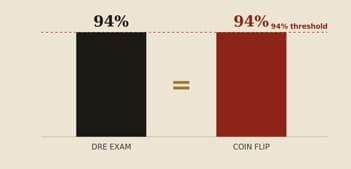
Figure 2. On Compton’s pre-selected sample, an examiner who abandoned the exam entirely and simply guessed “impaired” — by flipping a coin — would have scored the same 94%. The methodology never showed the evaluation beats chance.
“Had officers abandoned the examination and predicted impairment at random — for example by flipping a coin — they would have achieved the same accuracy.”
— paraphrasing Kane, Journal of Negative Results in BioMedicine, 2013
03 / THE IMPOSSIBLE MATH
The numbers that were never collected
A genuine diagnostic test is judged by sensitivity (does it catch the truly impaired?) and specificity (does it clear the truly sober?). Computing either requires a full 2×2 table: true positives, false positives, true negatives, and false negatives.
But in the foundational field studies, toxicology was ordered only when the driver failed the evaluation. When the DRE said “not impaired,” no blood was drawn. That means the true-negative and false-negative cells were never filled in. Half the table is simply missing — and without it, sensitivity and specificity cannot be calculated at all.
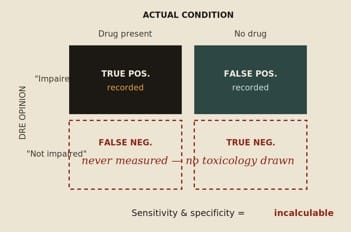
Figure 3. Because drivers judged “not impaired” were never tested, the lower half of the diagnostic table is empty. The reported “false negatives” are not real ones — they merely count people impaired by a different drug than predicted, making the true error rate unknowable but certainly worse.
04 / THE FOUNDATION THAT DOESN’T HOLD
Three studies, eight biases
Three studies are cited again and again in American prosecutions: Bigelow (the “Johns Hopkins” lab study), Compton (“LAPD 173”), and Adler (the “Arizona” study). When assessed with QUADAS — the standard tool for grading diagnostic-accuracy research — they fail across the board. None reference-tested actual driving performance or genuine mental or physical impairment; all investigated procedures different from those used by officers today; and each was riddled with bias.
selection bias · forensic selection bias · spectrum bias · misclassification bias · verification bias · differential verification bias · incorporation bias · review bias
The conclusion of the peer-reviewed analysis is blunt: these validation studies do not validate current practice. They quantify the prevalence of drugs in hand-picked samples and the method’s internal consistency — not its ability to tell an impaired person from a sober one.
05 / THE “DRUG” FALLACY
One word, many pharmacologies
Even the idea of a single “accuracy” figure is incoherent. It assumes drug is one homogeneous thing. It isn’t. Different substances produce different signs, so the evaluation’s real accuracy swings wildly from one class to the next — high for PCP, low for benzodiazepines. A blended “PCP-and-benzodiazepine” accuracy number describes neither, and shifts every time the mix in the sample changes. The headline statistic is not just inflated; it is meaningless as applied to any individual defendant’s actual drug.
06 / CRUDE INSTRUMENTS
Eyeballing the eyeball
The vaunted eye examination comes down to an officer estimating each pupil’s diameter to the nearest 0.5 mm using a handheld card, across changing light conditions, then comparing it to a chart of “average” ranges. It is a guess against a template — not a measurement.
And the laboratory backstop is shakier than juries are told. A real blood-THC result can carry enormous measurement uncertainty — in one Florida lab report, a reading of 4.9 ng/mL came with a margin that works out to roughly 73% total uncertainty.
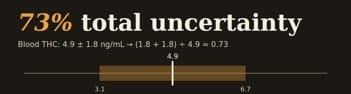
Exhibit. The “hard number” on the lab sheet hides a band wide enough to swallow the result.
07 / THE TAKEAWAY
Appearance vs. evidence
Here is the line that lands with a fact-finder: the DRE program has the appearance of forensic science — the protocol, the certification, the percentages — but the literature beneath it measures population drug prevalence and the method’s own circular consistency, never the one thing that matters: can this officer actually distinguish an impaired person from a sober one?
On the published record, that question has never been answered. And a test that has never been shown to beat a coin flip has no business being called “expert.”
Sources & Further Reading
Kane, G. The methodological quality of three foundational law enforcement drug influence evaluation validation studies. Journal of Negative Results in BioMedicine, 2013;12:16.
Heishman, S.J., Singleton, E.G., Crouch, D.J. Laboratory validation study of the Drug Evaluation and Classification program. J. Analytical Toxicology, 1996;20(6).
Foundational studies discussed: Bigelow (1985), Compton (LAPD 173, 1986), Adler (Arizona, 1994).
Blood, Drugs and the DRE Pupil (University Medical & Forensic Consultants, 2021).
This article summarizes published critiques of the Drug Evaluation and Classification program for educational purposes. It is not legal advice; consult qualified counsel and the primary sources for any case-specific use.